
The short version
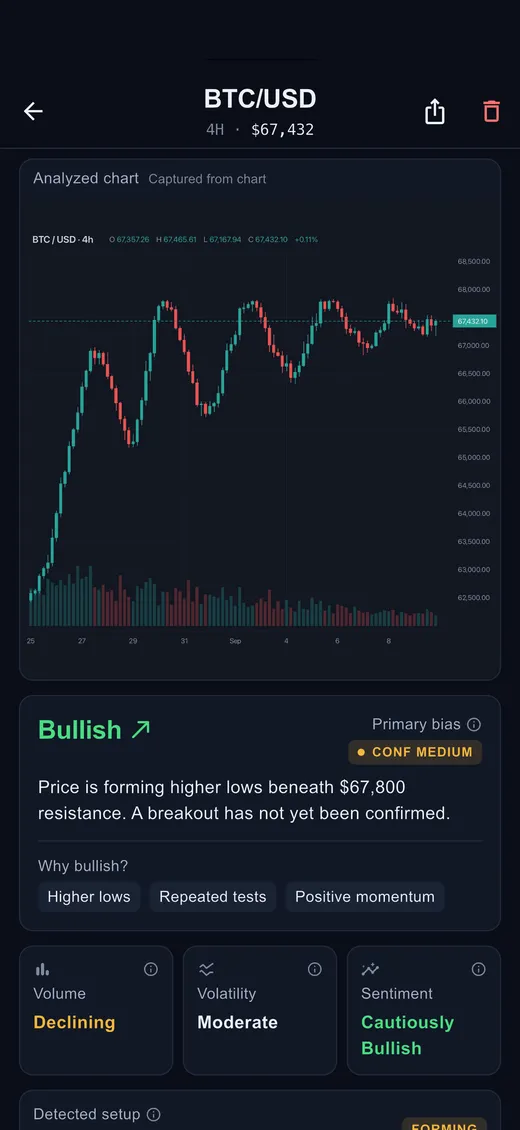
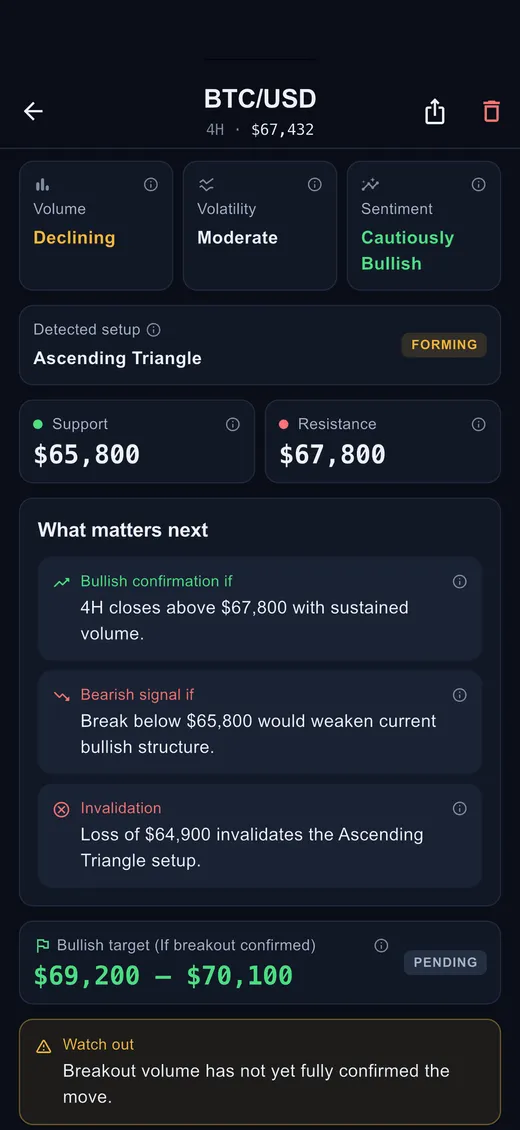
Technical analysis is a procedure. You establish the trend, mark the levels price keeps reacting to, check whether a recognisable pattern has formed and whether its context requirement is actually met, then state what would prove the read wrong. It is methodical work, and doing it properly on a chart takes a trained eye several minutes.
That procedure is what automated chart analysis compresses. It is fast and it is consistent, which matters more than it sounds: it applies the same checks in the same order every time, and it does not skip the inconvenient step because the chart already looks like something. Where it has no advantage at all is in knowing the future, and no amount of model quality changes that.
What a read actually contains
What it does
- Reads the chart in the image
- Candle geometry, the trend across the visible range, volume where it is shown, and the horizontal prices the chart has reacted to more than once.
- Names what formed
- The candlestick and chart patterns present, with the context requirement checked rather than assumed, so a hammer after a rise is not reported as a hammer.
- Marks the levels that matter
- Support and resistance derived from the price action on screen, plus the specific level that would invalidate the read.
- Explains its reasoning
- Every conclusion carries the evidence behind it, so you can disagree with a specific step rather than accepting or rejecting a verdict whole.
Where it stops
- It does not forecast price
- No model reads a chart image and knows where price goes. What it can do is describe the balance of pressure the chart already shows, which is a different and much more honest claim.
- It does not know the news
- An image contains no earnings date, no funding rate, no policy meeting tomorrow morning. A technical read is one input, and it is blind to the reasons behind the moves it describes.
- It cannot see beyond the crop
- Analysis covers the range in the picture. A level that matters from six months ago is invisible if the screenshot starts three weeks back, which is why the crop you send is part of the question you are asking.
- It is not a decision
- A structured read makes your own reasoning faster and more specific. It does not replace it, and anything claiming otherwise is selling certainty that does not exist in markets.
Why the limits are the point
There is a lot of software in this category promising to tell you what to do with your money. It is worth being clear about why Chartix does not, beyond the obvious regulatory reasons.
A read you are handed and cannot interrogate teaches you nothing and leaves you unable to tell a good one from a bad one. A read that shows its evidence does the opposite: you can check each step against the chart, find the one you disagree with, and be better at it next time. Over a few hundred charts that difference compounds into actual skill, which is the only thing in this field that keeps paying.
That is also why every analysis names an invalidation level. A conclusion that cannot be proved wrong is not analysis, and the discipline of stating the price that would break the read is the single most useful habit technical analysis has.
Common questions
- What charts does it work on?
- Any chart you can photograph or screenshot: stocks, crypto, forex, indices, futures and commodities, from any broker or charting platform. It reads the picture, so the source does not matter. Crop tightly to the chart itself and leave account details out of frame.
- Does it need to connect to my brokerage account?
- No. It works from an image, with no account linking, no API keys and no access to your positions. That is a deliberate design choice, not a missing feature.
- How accurate is it?
- On what a chart shows, which is what it reports, it is reliable and consistent: candle geometry, trend across the visible range and the levels price has reacted to are all readable from the image. On what happens next, nobody is accurate, and any product quoting you a hit rate on that is quoting a backtest. The analysis is AI-generated and can be incomplete, which is why it always shows its reasoning and always names what would invalidate it.
- Is this a signal service?
- No. Chartix explains what a chart shows and teaches the reasoning behind it. It issues no recommendations, executes nothing, and holds no funds.
Learn the read yourself
The fastest way to get value from an automated read is to be able to check it. The candlestick pattern library covers every pattern worth knowing with its formation rules and its failure modes, and how to read a stock chart covers the five questions the whole method reduces to.