Pattern detection
Names what actually formed
Candlestick and chart patterns identified with their context requirement checked, not assumed. A hammer after a rally is not a hammer, and the read says so.
AI chart analysis
Photograph a chart, or drop in a screenshot. Chartix names the pattern, marks the levels, reads the trend, and tells you the exact price that would prove it wrong.
Free to download. Stocks, crypto, forex, indices and futures.
How it works
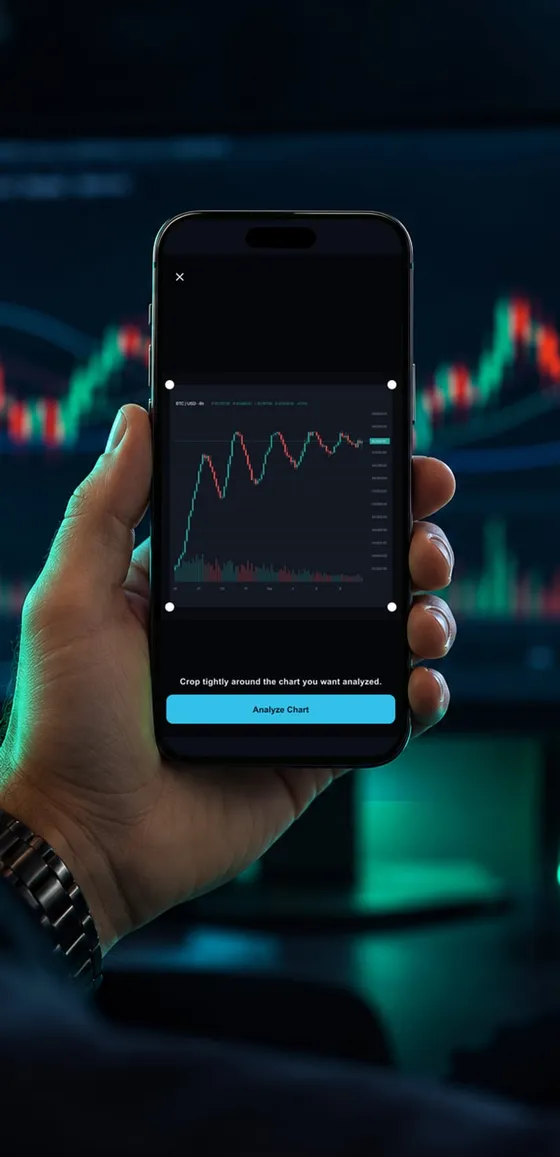
Photograph a chart on another screen, or import a screenshot straight from your broker or charting app. Drag the handles to crop to the chart itself and leave your account details out of frame.
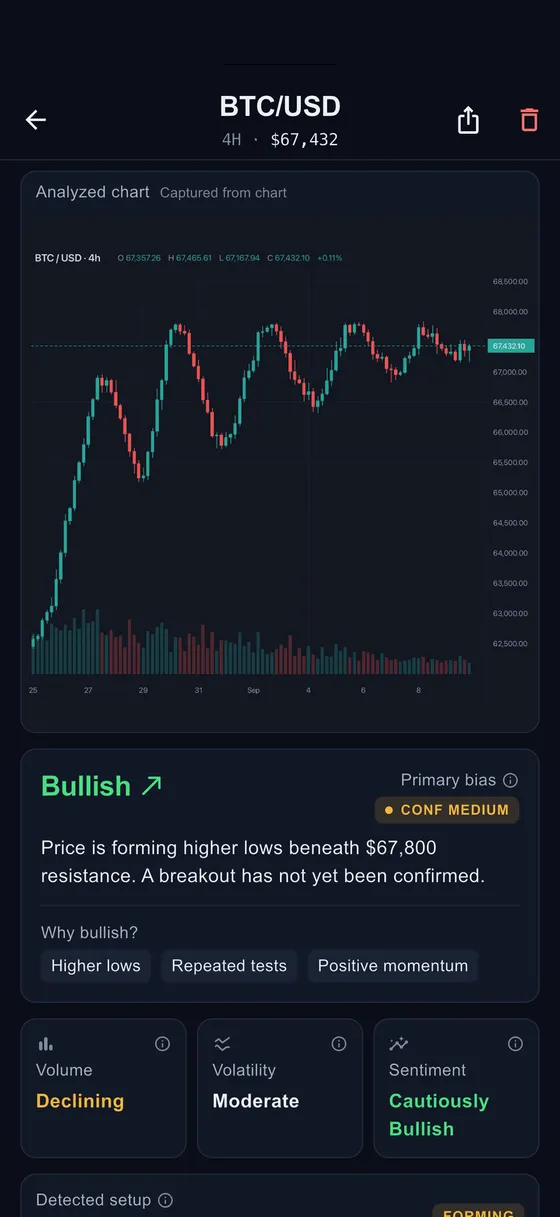
A single bias call sits at the top, followed by the specific evidence for it: the structure of the highs and lows, what volume is doing, and how much the picture is actually agreeing with itself.
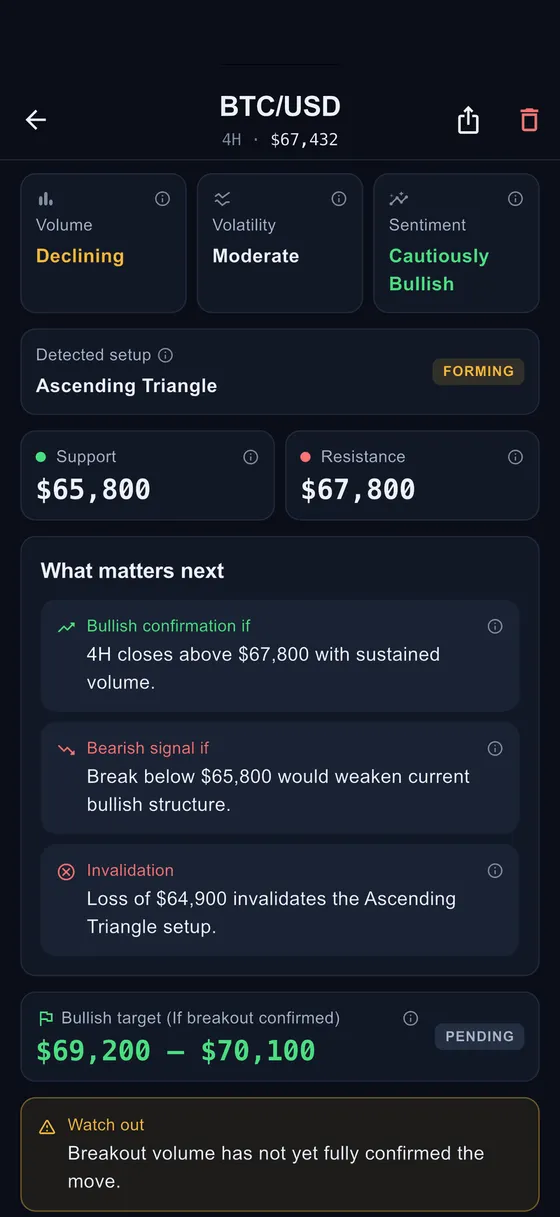
The setup it detected, the support and resistance around it, what would confirm the move, and the exact level that would invalidate it. That last one is the part that turns an impression into a plan.
Pattern library
Every pattern drawn to its real proportions, with the formation rules, what traders read into it, and the places it reliably fools people. Free to read, no app required.
What a read contains
Each scan returns the same structured read, so you can compare one chart against another instead of starting from scratch every time.
Candlestick and chart patterns identified with their context requirement checked, not assumed. A hammer after a rally is not a hammer, and the read says so.
Support and resistance drawn from where price has actually reacted more than once, plus the invalidation level that would break the whole read.
A five-state bias from strongly bearish to strongly bullish, always accompanied by the specific reasons behind it so you can check each step yourself.
The supporting readings that tell you how much to believe the price action, summarised so you can see at a glance whether the picture agrees with itself.
Tap any term in a read for a plain-English definition without leaving the analysis. The fastest way to learn technical analysis is in the middle of using it.
Stocks, crypto, forex, indices, futures and commodities, from any platform. It reads the picture, so no account linking and no API keys are involved.
Straight answers
Any price chart you can photograph or screenshot: stocks, crypto, forex, indices, futures and commodities, from any broker or charting platform. Candlestick charts give the richest read because they carry four prices per bar, but line and bar charts work too.
No. Chartix works entirely from an image, with no account linking, no API keys, and no visibility of your positions. That is a deliberate design decision rather than a feature still to come.
No, and that is the design. Chartix explains what a chart shows and why, so the judgement stays yours and gets sharper each time. Software that hands you a verdict you cannot interrogate teaches you nothing and leaves you unable to tell a good read from a bad one.
On what a chart shows, which is what it reports, it is consistent and reliable: candle geometry, trend across the visible range, and levels price has reacted to are all readable from the image. On what happens next, nobody is accurate. Every read names the level that would prove it wrong, which is the honest version of a confidence score.
No. Every term in a read has a one-tap definition, and each analysis spells out the reasoning rather than just the conclusion, so the app is usable on day one and teaches as you go. The pattern library on this site covers the same ground at your own pace.

Point the camera at it and find out what it is telling you.

Free to download